Overview
Every previous post in this series proxies, agents, autoregistration, process logging, proxy load balancing, LLD, and PSK/TLS has been a slice of the same picture. This post zooms out and shows the full architecture they belong to, plus the practices that keep it stable as you grow past 10k hosts.
This guide assumes you've followed (or skimmed) the rest of the series and are comfortable with Zabbix terminology: server, proxy, agent, item, trigger.
The Reference Architecture
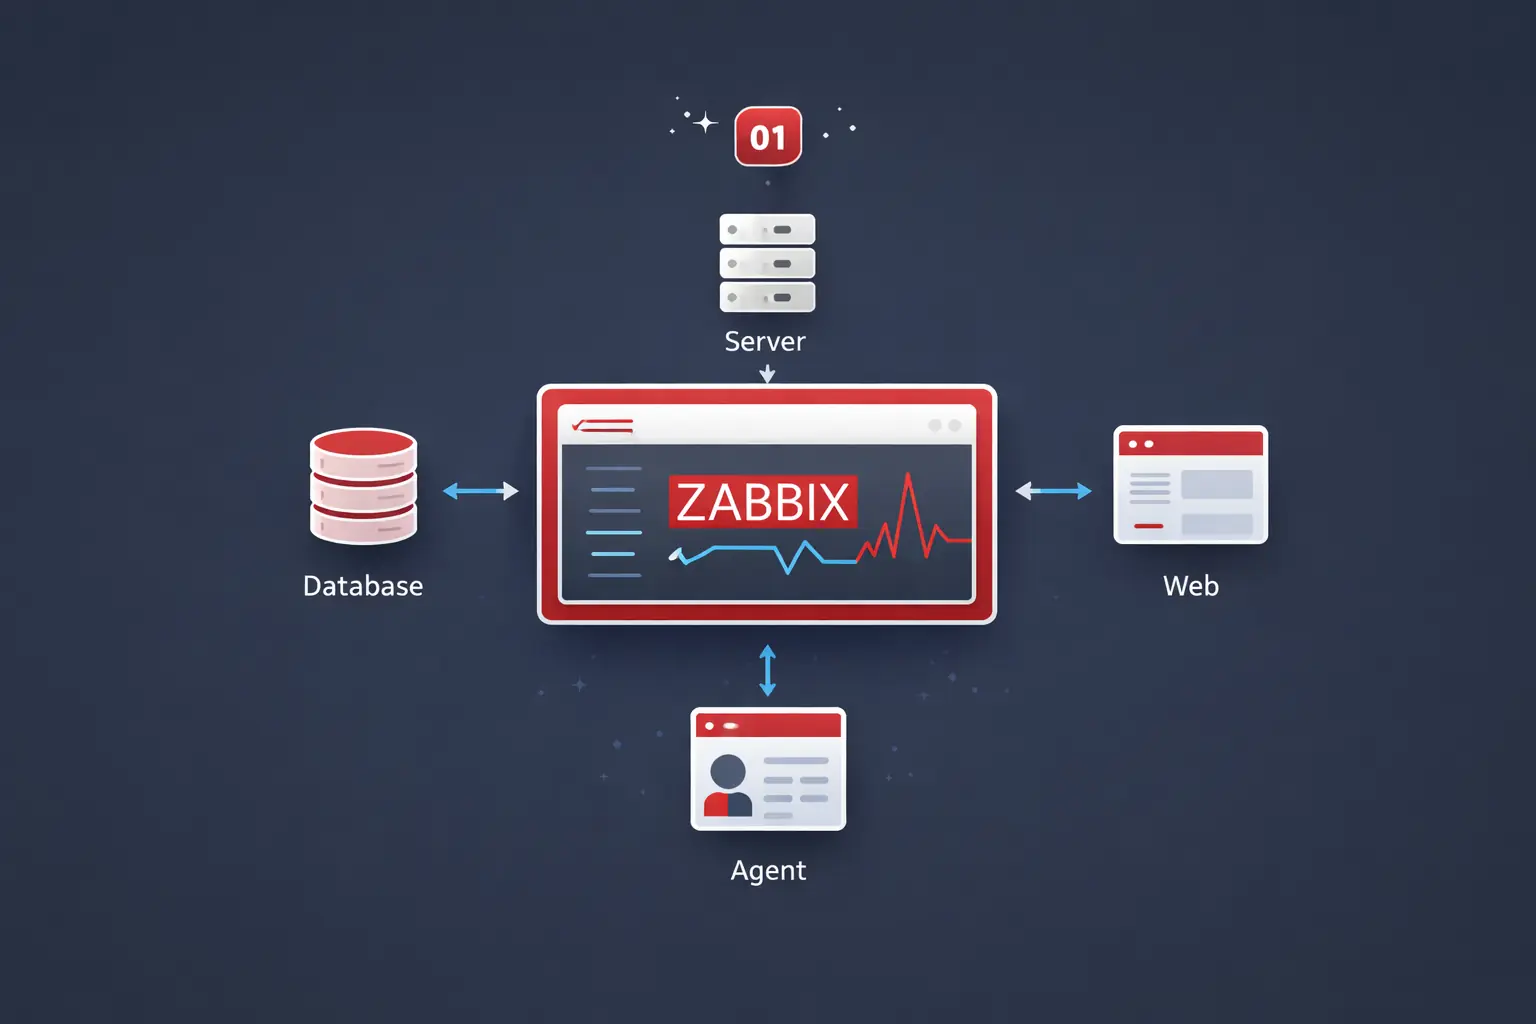
A production Zabbix deployment has five logical tiers. Each can be scaled independently.

The five tiers:
- Agents one per host. Encrypted via PSK (see the hardening post).
- Proxy fleet N proxies, sharded by hash/region/role. See the load-balancing post.
- Database tier PostgreSQL with TimescaleDB for history, with streaming replication.
- Server tier two
zabbix-serverprocesses in active/standby. Only one is ever active. - Frontend tier Stateless PHP / nginx behind a load balancer.
The single most important rule: scale tiers independently. If you cram the database, server, and frontend onto one VM, you'll hit a wall at ~1k hosts and have nowhere to go.
Sizing the Tiers
The numbers below assume Zabbix 6.4 LTS on commodity hardware. Treat them as starting points every workload is different.
| NVPS | Hosts (avg) | Server | DB | Proxies |
|---|---|---|---|---|
| < 1k | < 500 | 4 vCPU, 8 GB | 4 vCPU, 16 GB, 200 GB SSD | 1 |
| 1k–5k | 500–3k | 8 vCPU, 16 GB | 8 vCPU, 32 GB, 1 TB NVMe | 2–4 |
| 5k–20k | 3k–10k | 16 vCPU, 32 GB | 16 vCPU, 64 GB, 2 TB NVMe | 4–10 |
| 20k+ | 10k+ | 16 vCPU, 64 GB | 32 vCPU, 128 GB, dedicated | 10+, regionally placed |
Disk I/O is the #1 bottleneck. Local NVMe beats network-attached storage every time for the Zabbix DB. If you must use network storage, demand sub-millisecond
fsynclatency or you'll regret it.
Server Tier: Native HA
Zabbix 6.0+ ships with native high availability. No more PCS, no more keepalived hacks.
Each server in the cluster sets the same node name table and a unique node ID. Edit /etc/zabbix/zabbix_server.conf on every server node:
HANodeName=zabbix-srv-01            # unique per node
NodeAddress=10.0.0.21:10051         # how proxies/agents reach this node
Restart, then verify in the frontend under Reports -> System information:
HA cluster: Enabled
Nodes:
  zabbix-srv-01   active     10.0.0.21
  zabbix-srv-02   standby    10.0.0.22
Failover takes ~30 seconds. The standby promotes itself automatically when the active node misses its heartbeat. Proxies that listed both servers (
Server=10.0.0.21,10.0.0.22from the very first post) reconnect to the new active node without intervention.
Database Tier: PostgreSQL + TimescaleDB
For anything past 1k hosts, PostgreSQL with TimescaleDB is the right answer. MySQL still works, but Timescale's hypertables and built-in compression turn the history tables by far the biggest in any Zabbix DB from a problem into a solved one.
Why TimescaleDB
- Automatic partitioning by time. Old chunks become tiny, fast scans on recent data stay tiny too.
- Native compression typical 10x reduction on
history*tables. - Drop chunks instead of
DELETEhousekeeper finishes in seconds instead of hours.
Enable it after install:
CREATE EXTENSION IF NOT EXISTS timescaledb CASCADE;
SELECT create_hypertable('history',         'clock', chunk_time_interval => 86400, migrate_data => true);
SELECT create_hypertable('history_uint',    'clock', chunk_time_interval => 86400, migrate_data => true);
SELECT create_hypertable('history_str',     'clock', chunk_time_interval => 86400, migrate_data => true);
SELECT create_hypertable('history_text',    'clock', chunk_time_interval => 86400, migrate_data => true);
SELECT create_hypertable('history_log',     'clock', chunk_time_interval => 86400, migrate_data => true);
SELECT create_hypertable('trends',          'clock', chunk_time_interval => 2592000);
SELECT create_hypertable('trends_uint',     'clock', chunk_time_interval => 2592000);
Then in the Zabbix frontend under Administration -> General -> Housekeeping, tick "Override item history period" and "Override item trend period". Zabbix will use Timescale's chunk drop instead of row-by-row deletes.
Replication
For HA, run streaming replication with at least one synchronous standby and one asynchronous replica:
- Synchronous standby: same DC, no data loss on failover.
- Async replica: another DC, for DR and read-only reporting.
Use pg_auto_failover, Patroni, or a managed service (RDS, Cloud SQL, Azure Postgres) don't roll your own failover.
Back up the database, not the Zabbix server. The server is stateless config + a binary. The DB is everything: hosts, items, history, trends, the audit trail.
pg_basebackup+ WAL archiving is the floor.
Proxy Fleet
Recap from the load-balancing post:
- One proxy per ~1k–2k hosts with SQLite, more if you give it a real DB.
- Active proxies (proxy connects to server) are easier to firewall and easier to scale. Prefer them over passive.
- Region/site placement matters more than sheer count. A proxy in the same DC as its hosts cuts collection latency 10x.
- Hash-based sharding keeps the load even and survives proxy loss without UI work.
| Pattern | When to use |
|---|---|
| One proxy per site | Multi-region, latency-sensitive |
| One proxy per role | Network gear separated from servers/apps |
| Hash sharding | Uniform fleet, you just want even spread |
| Tenant-per-proxy | MSP / multi-customer setups |
Frontend Tier
The PHP frontend is stateless sessions live in the DB, not on disk. That makes it trivial to scale:
- Two or more identical web nodes (nginx + PHP-FPM).
- A TCP / HTTP load balancer (HAProxy, AWS ALB, nginx upstream) in front.
- Sticky sessions are not required, but enabling them improves cache hit rates.
upstream zabbix_frontend {
    least_conn;
    server zabbix-web-01:8080 max_fails=2 fail_timeout=10s;
    server zabbix-web-02:8080 max_fails=2 fail_timeout=10s;
}

server {
    listen 443 ssl http2;
    server_name zabbix.example.com;

    ssl_certificate     /etc/ssl/zabbix.crt;
    ssl_certificate_key /etc/ssl/zabbix.key;

    location / {
        proxy_pass http://zabbix_frontend;
        proxy_set_header Host              $host;
        proxy_set_header X-Real-IP         $remote_addr;
        proxy_set_header X-Forwarded-For   $proxy_add_x_forwarded_for;
        proxy_set_header X-Forwarded-Proto $scheme;
    }
}
Terminate TLS at the load balancer, not at every web node. Cert rotation becomes a one-host job.
Performance Tuning Checklist
The defaults assume a single-server, < 500-host deployment. Past that, tune the following on zabbix_server.conf (and analogously on proxies):
# Pollers do passive checks (server -> agent)
StartPollers=80
StartPollersUnreachable=20

# IPMI, SNMP trapper, history syncers - scale with NVPS
StartIPMIPollers=4
StartTrappers=20
StartHistorySyncers=8

# Preprocessing workers - critical for templates with heavy preprocessing
StartPreprocessors=20

# Cache sizes - go big, RAM is cheap
CacheSize=2G
HistoryCacheSize=512M
HistoryIndexCacheSize=256M
TrendCacheSize=256M
ValueCacheSize=2G
Then watch Reports -> System information for busy % of each process type. Anything sitting above 75% busy is your next bottleneck.
Tune one knob at a time and let the system run for at least 24 hours between changes. Multiple simultaneous changes make it impossible to attribute improvement (or regression) to the right cause.
Monitoring Zabbix With Zabbix
Self-monitoring is non-negotiable. Link the Zabbix server health template (built-in) to a host called Zabbix server and you immediately get:
- Internal queue depth
- Cache utilization
- Process busy %
- Trapper / poller throughput
- HA node status
For proxies, do the same with the Zabbix proxy health template (we touched this in the original proxy post).
Set triggers on:
Zabbix queue over 1000 items for more than 10mcollection is falling behind.Cache utilization > 80%bumpCacheSize.History syncer > 75% busyDB is the bottleneck.HA node lost heartbeatfailover happened, investigate why.
Operational Best Practices
A grab-bag of things you only learn the hard way:
- Templates are code. Export them to git (
POST configuration.export), code-review changes, deploy via the API. Never edit live in the UI past prototype phase. - One template per concern.
OS-Linux-Base,App-Nginx,Net-IfStats. Compose them on hosts. Monolithic "everything for app X" templates are unmaintainable. - User macros for environment differences.
{$DB.PORT},{$THRESHOLD.CPU}. Override per host or per group, never duplicate templates. - Quiet your alerts before you scale them. Dependencies, maintenance windows, and trigger hysteresis (
>90% for 5m, recover at <70%) prevent the 3 AM cascade. - Audit log retention. Crank it to a year. When something mysteriously changes, the audit log is the only thing that tells you who.
- Test failover quarterly. A failover that's never been rehearsed is not a failover, it's a hope.
- Patch the DB on its schedule, not Zabbix's. Postgres minor upgrades are cheap; Zabbix major upgrades are not. Keep them decoupled.
- Never run the housekeeper with default settings on a large DB. Use TimescaleDB chunk drops or partition the tables manually.
A Capacity-Planning Cheat Sheet
When someone asks "can Zabbix handle X?", the answer almost always reduces to four numbers:
- NVPS
(items per host) * (hosts) / (average update interval). - History writes/sec roughly equal to NVPS.
- DB IOPS
~3xhistory writes/sec on a tuned PG + Timescale setup. - Network
NVPS * ~200 bytesper metric on the wire (encrypted).
Plug your target into those four and you'll know in five minutes whether the architecture above will hold or whether you need to shard further.
What to Do Next
A Zabbix deployment that scales is not a magic configuration it's the same building blocks the rest of this series covered, arranged so each tier can grow on its own. Get the database right, keep the server tier HA, shard the proxies, encrypt every hop, and treat templates like the code they are. Do that and the difference between 100 hosts and 10,000 hosts is mostly more hardware.
Three concrete moves to validate your architecture before it falls over:
- Calculate NVPS, queue, DB IOPS, and network from your actual host count. Plug your numbers into the four formulas above. If any one of them shows a tier sized for "current load + 0%", that's the next bottleneck and you'll feel it within a quarter.
- Add a server-tier HA pair before you need it. A single Zabbix server is fine until the night the disk fills and you discover backups don't restore cleanly. Standby + shared storage (or DB replica) is a one-day project; doing it after an outage is a week of cleanup.
- Pick the proxy sharding axis explicitly. Geography, network segment, customer, environment whichever you pick, write it down. The most expensive architecture mistake at scale is "we sharded by whatever was convenient at the time" because rebalancing later means rewriting host groups across the whole fleet.
Pairs naturally with the proxy load-balancing post (the operational pattern this architecture relies on) and the templates as code post (the GitOps layer that keeps every tier reproducible).